RoomSense
Hotels heat empty rooms as if a guest were about to walk in. RoomSense picks a setpoint for every vacant room from its own sun, neighbours and next booking, and warms it back in time. It started as a hackathon 3D twin, and grew into a Swedish-first dashboard for facility managers and owners, modelled on a 500-room Stockholm hotel.
- Role
- Design lead
- Platforms
- Web
- Team
- Techtify: I led the design; Niklas, Dante and Niki built it
- Made at
- Techtify Labs · in-house product
- Disciplines
- Product design · UI/UX · Data visualisation
Context
Most hotels set every empty room back to the same temperature, or not at all. But two rooms in one building behave very differently: a corner room on the top floor facing north is not a sunny room between two occupied ones. A flat rule either wastes heat or risks a cold room when the guest arrives.
Who it's for
Facility managers who act on it every morning, reception staff who assign rooms, and owners who need to trust the savings before they sign.
Constraints
- 01The building is real. The rooms come from its drawings and the model is checked against its energy declaration, so every figure is something a customer can hold us to.
- 02The guest's comfort is the promise. A saving that risks a cold arrival is not a saving.
- 03Swedish first, English second. The people who use it daily work in Swedish.
- 04Room sensors and the heat meter weren't connected yet, so much of what the screen shows is still an example.
My role
I led the design of RoomSense. Niklas, Dante and Niki built it. At the hackathon I designed the 3D twin: the building as individual room boxes, the real neighbourhood around it, and the comparison of a flat setback against a per-room policy. In the product I redesigned every dashboard view, reworked the savings views so their numbers agree with each other, and made the full-screen demo deck for customer meetings.
- Design of the hackathon 3D twin and its interaction model
- Swedish-first redesign of every dashboard view, and the twin in Swedish and English
- One savings headline across the product
- Wording and "How is it calculated?" explanations
- The demo deck and the demo click path
Key decisions
The calls that shaped it
One number, quoted everywhere
- Problem
- In a walk-through before a customer demo, the yearly saving appeared in five places with five different values. Four of them came from the same model, presented four ways: with or without the demand charge, with or without simulated meter noise. The fifth came from the twin's own physics. Worse, the "normal year" figure changed between two tabs opened minutes apart, because it was computed from that moment's setpoints.
- Decision
- One headline, defined once: what RoomSense saves in a normal year, computed on fixed reference setpoints so it doesn't move with the clock or tonight's bookings. Every view quotes it, rounded the same way, including the twin's ticker. The demand charge moved to its own line, outside the headline.
- Why
- A customer who sees two different numbers stops trusting both. One honest, stable figure is worth more in a sales meeting than a bigger one that wobbles. Here the product truth was a design problem, not an engineering one.
Say what is an example
- Problem
- With sensors not yet connected, a lot of the screen was modelled: room telemetry, the meter, future bookings. Some of it read like a track record. A line such as "zero cold arrivals in 90 days" is exactly the sentence that gets quoted back in a meeting.
- Decision
- Every figure that is an example carries a "Demo data" badge. Generated telemetry says so in the sentence, not in a footnote. "How is it calculated?" opens every formula with a worked example. The demo script starts with one sentence before any number: everything here is a model's prediction for your building, not a measured saving yet.
- Why
- A savings product lives or dies on its baseline. Being clear about what's measured and what's modelled is what makes the real numbers believable when the meter is connected.
Two buildings, side by side
- Problem
- "Per-room optimisation" is invisible. On a chart it's one line under another, and nobody can see why room 3 gets a different answer than room 4.
- Decision
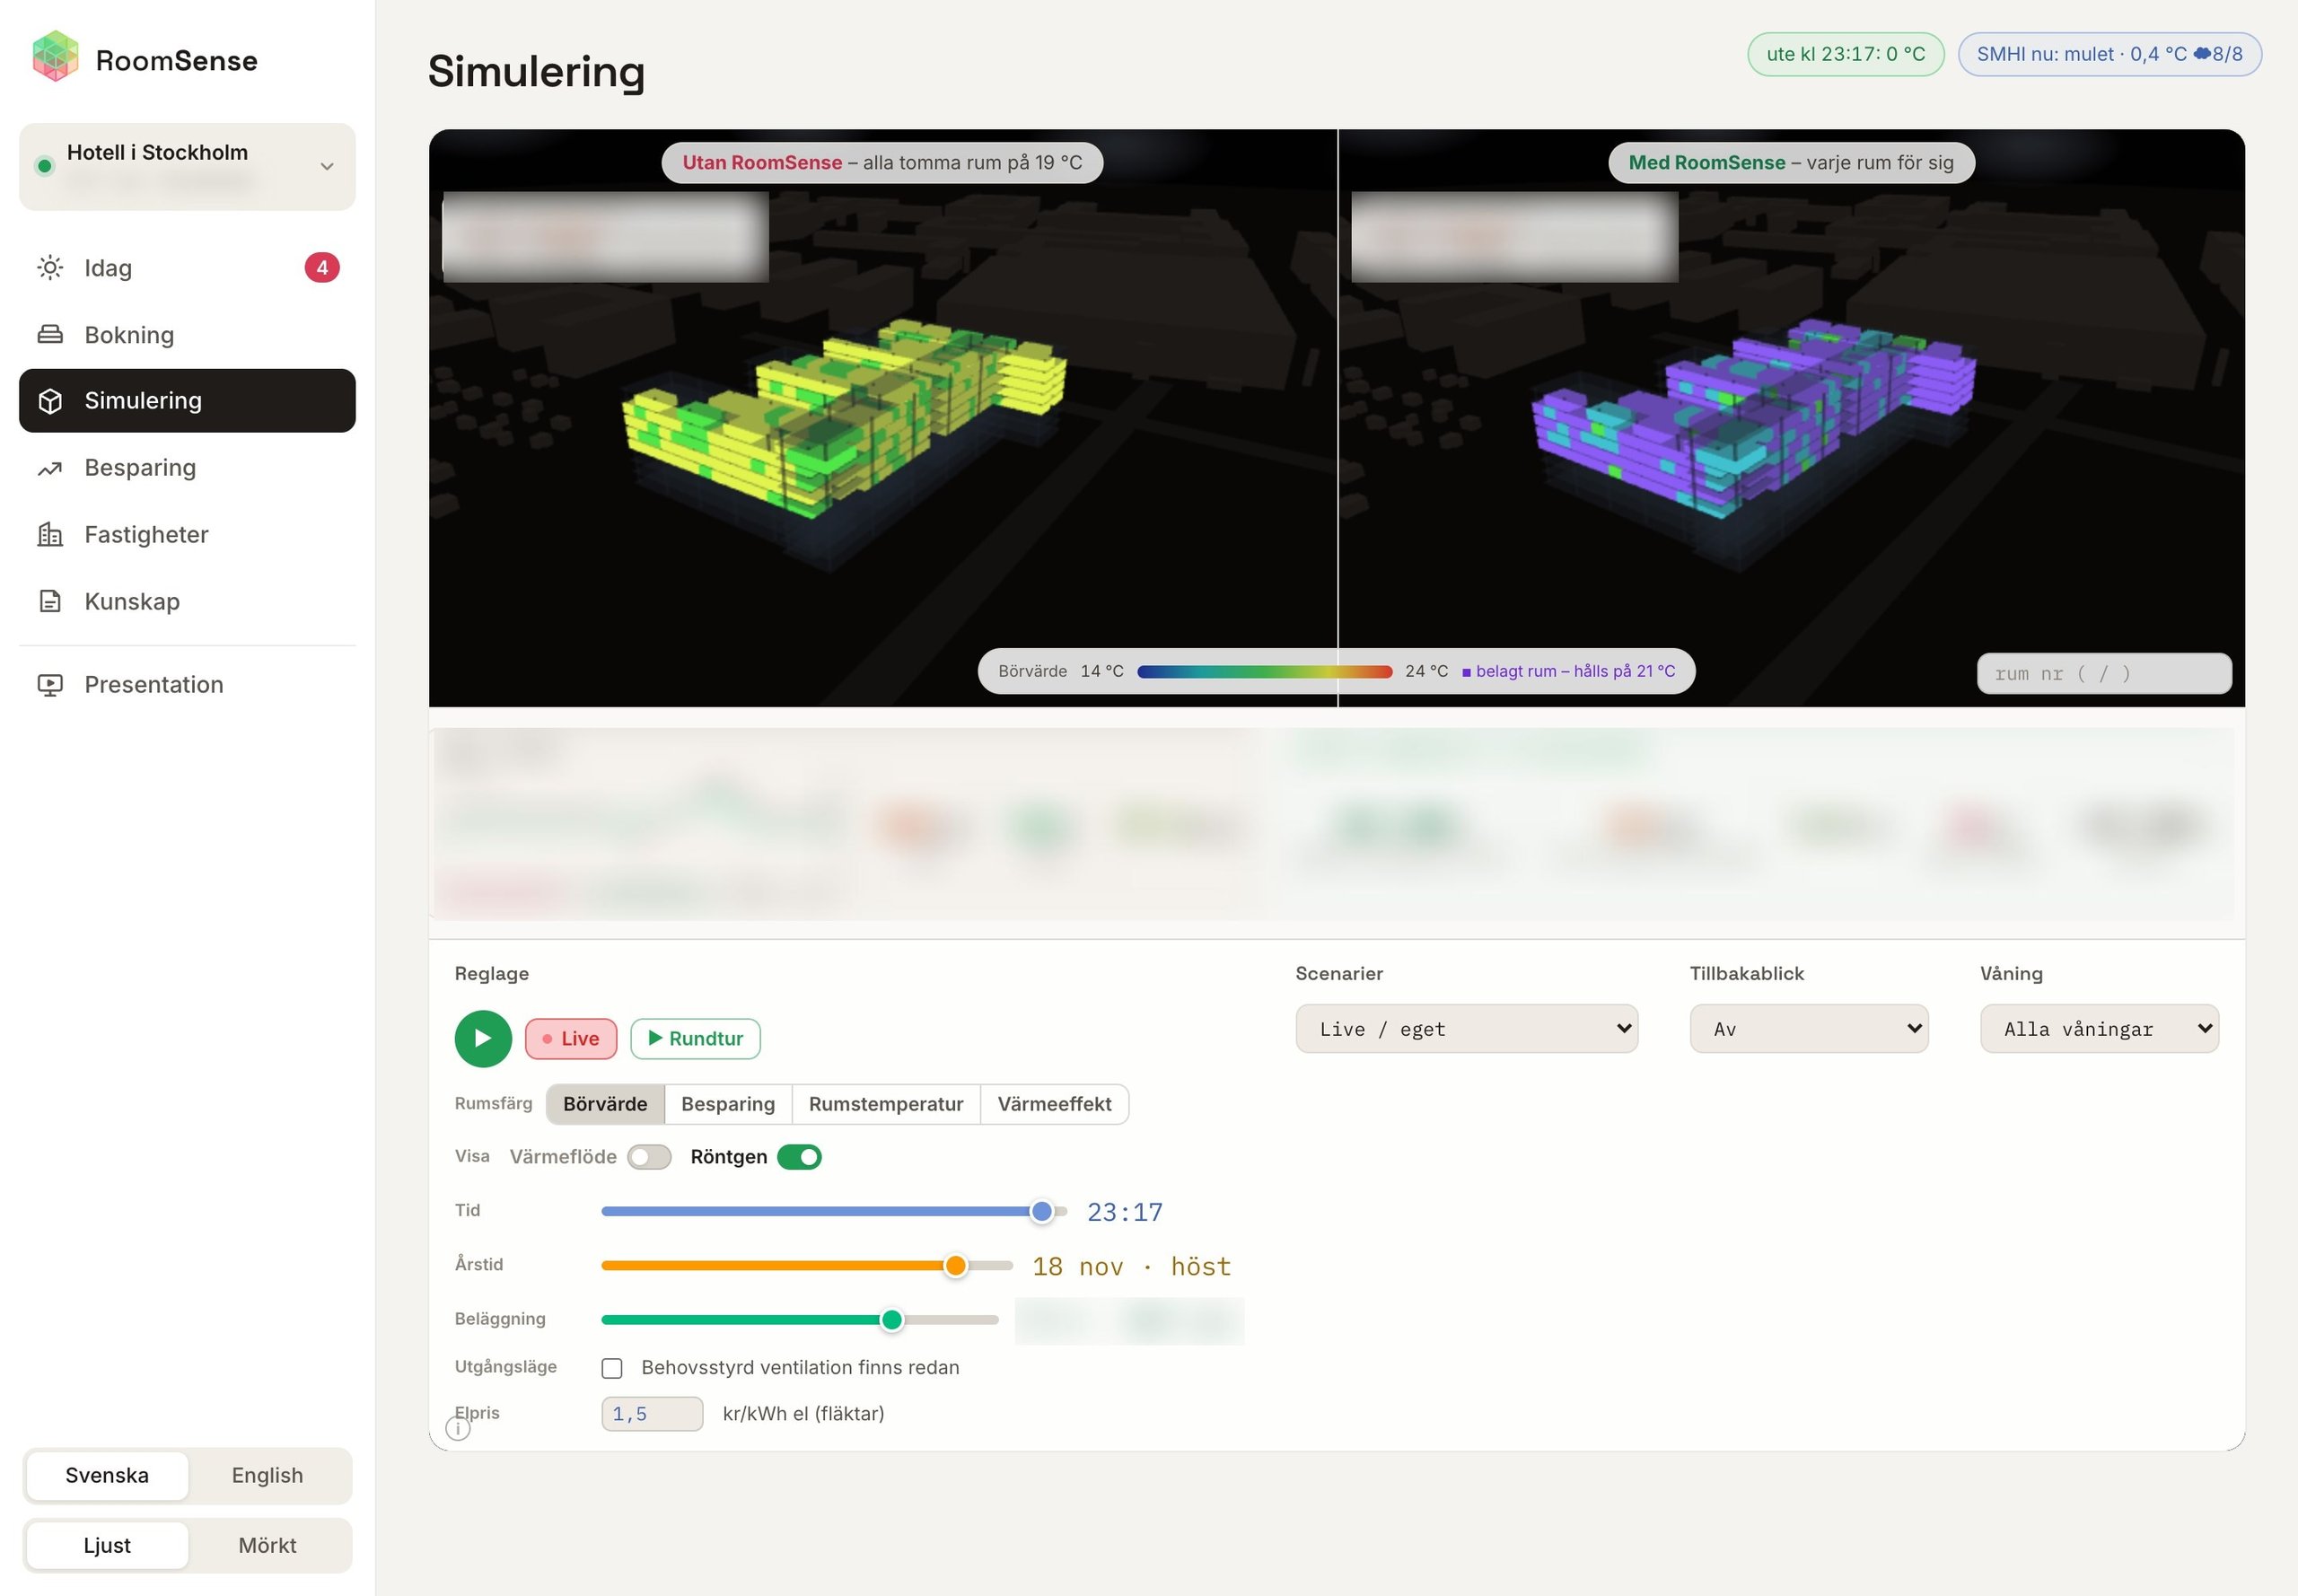
- The twin shows the building twice, in lockstep: a flat setback on the left and the per-room policy on the right. Drag either view and both cameras move. Time, season and occupancy sliders move the real sun and shadows from the surrounding buildings. Click any room and you get its setpoint, when to start warming, how long recovery takes and a plain-language reason.
- Why
- People understand it the moment they see the sunny side of the building stay cooler while the shaded corner is warmed first. The explanation on each room turns a black box into something a facility manager can argue with.
Gallery
Where it started
The hackathon twin: today's flat setback on the left, a setpoint per room on the right. Hotel name and savings figures are left out on purpose.
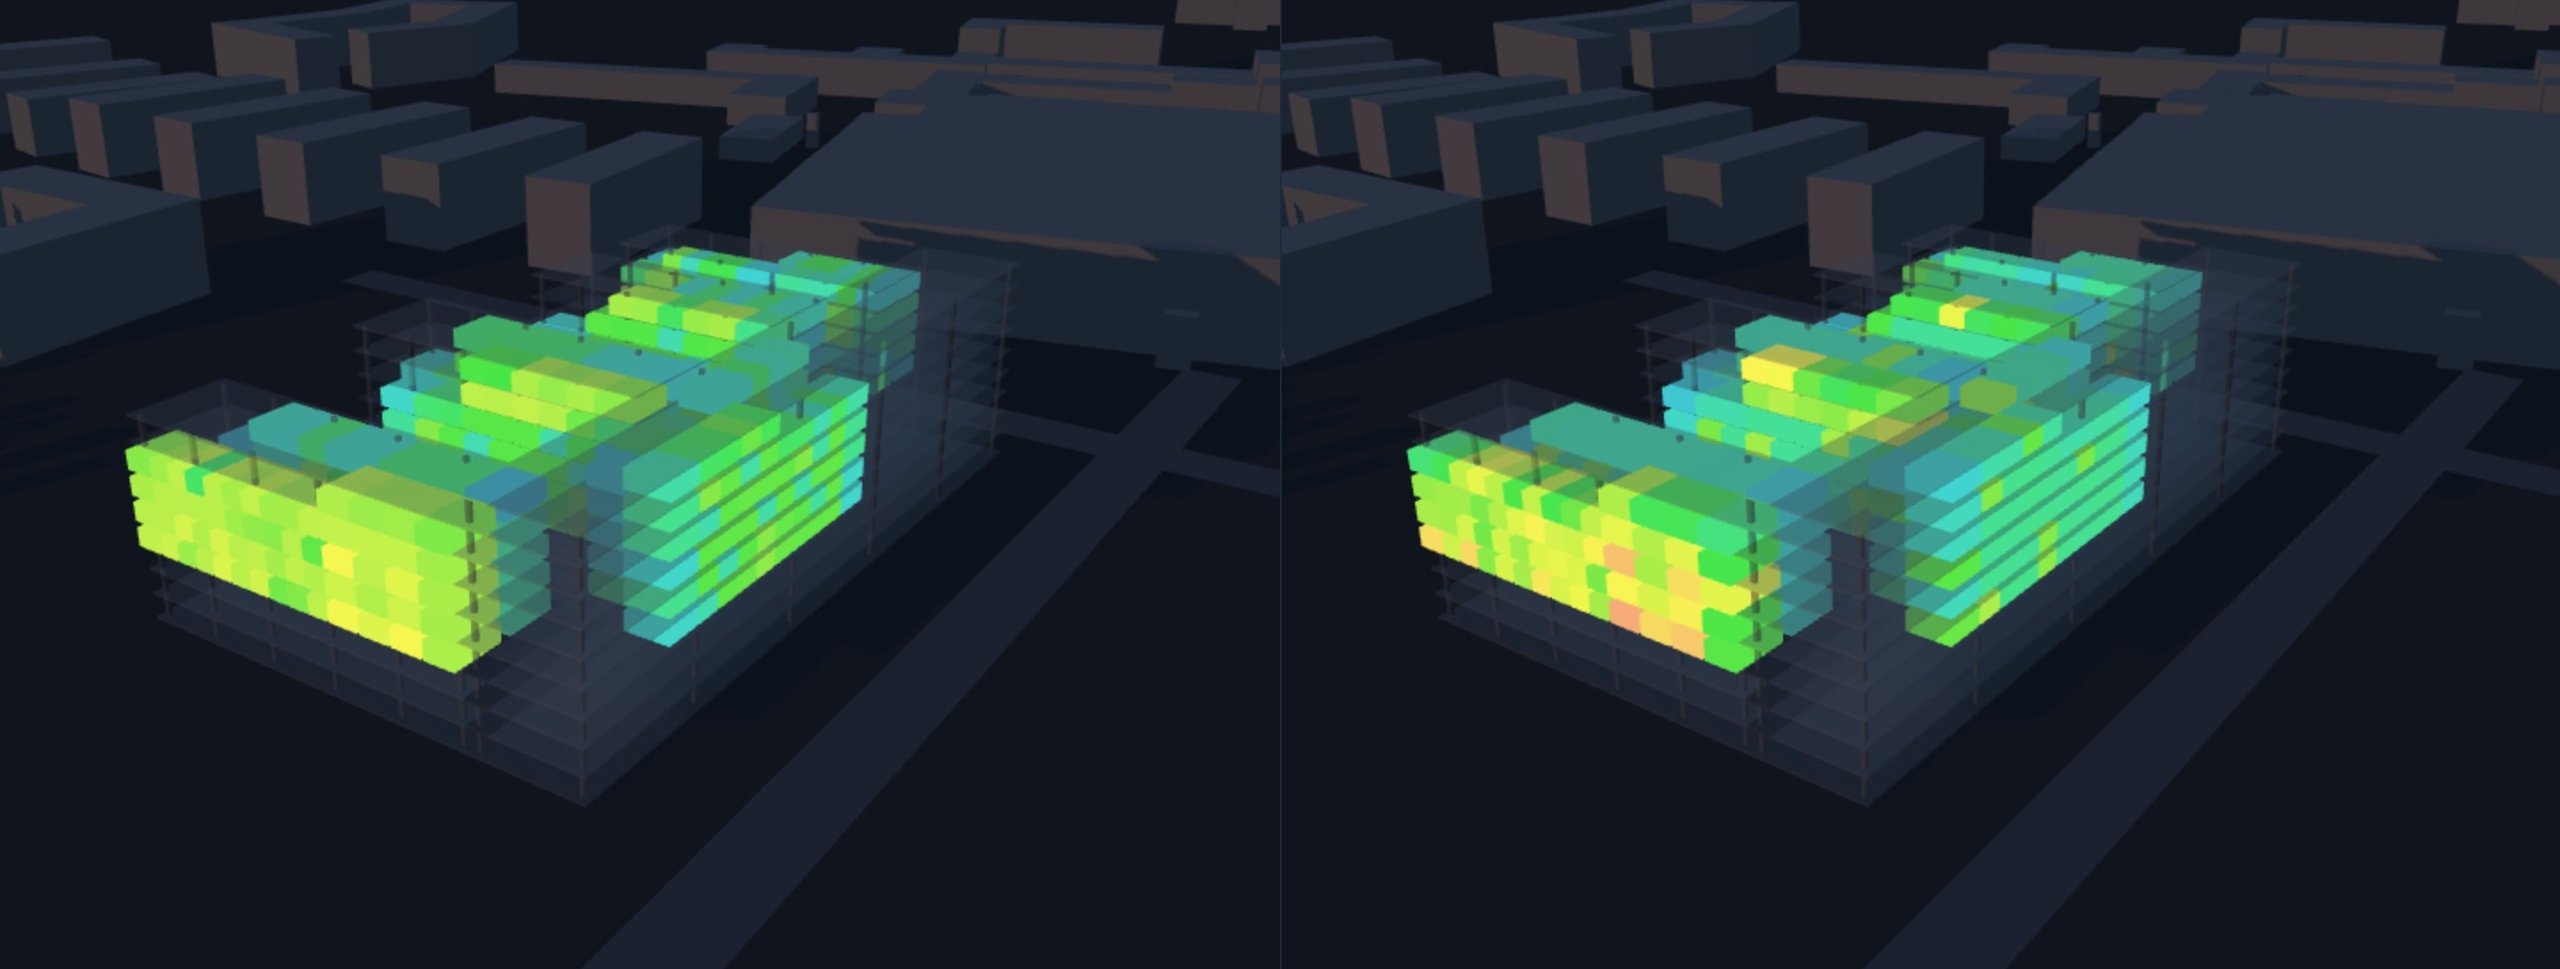
Flat setback (left) vs per-room policy (right)
Design system
The system
Warm neutrals so the data colours carry meaning. Each colour is a room state, and green always means a saving.
Space Grotesk
Headings and figures
Inter
Body and interface
- Light and dark themes, synced between the dashboard and the embedded twin
- Swedish first, English second, with server text sent as codes and worded by the dashboard
- Demo data has its own colour, so an example can never pass for a measurement
Outcome
Where it landed
RoomSense went from a hackathon twin to a dashboard Techtify takes to hotels, with views for the facility manager, reception and the owner. It is modelled on a real Stockholm hotel and is in a pilot. The savings are still a model's prediction until the hotel's meter is connected, and the product says so.